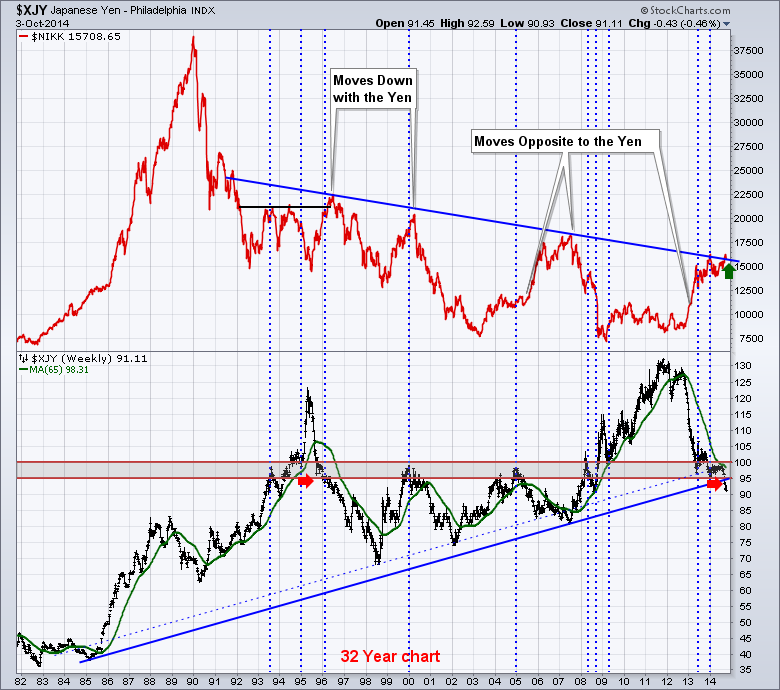
I have been very interested to watch the Japanese Equity Market ($NIKK) to see if it can hold the breakout from the 25 year trend line. First of all, here is a long chart.
Why does this matter? When a long trend line breaks it is usually very important. Lets zoom in on the last year:
