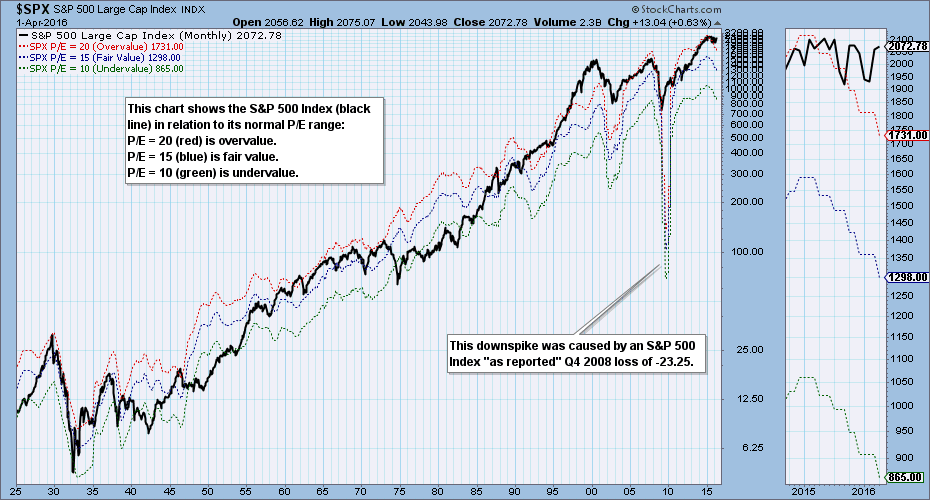
The preliminary S&P 500 Index 2015 fourth quarter earnings results are in, and it is once again time to look at our earnings chart, which shows the S&P 500 in relation to its normal value range. (Note: The chart is a static graphic, not an active chart.)

Continue reading “S&P 500 2015 Q4 Earnings Results: Market Even More Overbought” »